
How to Evaluate a Stock’s Financial Health with the V-Score in Vinley


Open any stock's financial statements and you're staring down dozens of ratios: Altman Z-Score, interest coverage, ROIC, P/FCF, dividend payout, the list goes on. Each one tells you something real, but taken individually none of them tells you the whole story. A company can look cheap on P/E and still be drowning in debt. It can have a beautiful balance sheet and still be priced for perfection.
That's the gap the V-Score is built to close. It's a single, weighted score, built from the same traffic-light checks you already see on every Vinley fundamentals page, that condenses a company's solvency, profitability, relative valuation, and shareholder returns into one number between 0% and 100%.
What Is the V-Score on Vinley app?
The V-Score (VSQS) is calculated as:
VSQS = R × [(0.40 × Solvency) + (0.30 × Profitability) + (0.20 × Valuation) + (0.10 × Dividends)]
Two things are doing the work here.
1. Four pillars, each built from a handful of familiar ratios, each carrying a different weight depending on how much it should matter to a long-term investor.
2. Second, a reliability multiplier, R, that sits outside the weighted average entirely and can override everything else.
The Reliability Gate: Why Earnings Quality Comes First
Before any pillar score counts for anything, the V-Score checks one thing: can you trust the numbers you're about to weight? That's what the Beneish M-Score measures, and it sets the multiplier R:
Beneish M-Score green (≤ −1.78): R = 1, the rest of the score passes through untouched.
Beneish M-Score orange (> −1.78 and ≤ 0): R = 0.5, the entire score is cut in half.
Beneish M-Score red (> 0): R = 0, the entire score goes to zero, no matter how good the rest of the metrics look.
This is a deliberate design choice, not an accident of the math. A company with excellent solvency and profitability ratios built on manipulated earnings isn't a good company with a footnote; it's not a good company at all. Rather than let earnings-quality concerns get diluted into a 10th of the total score, the V-Score treats reliability as a precondition. Everything else is only worth calculating once you can trust the inputs.
The Four Pillars of the V-Score

Once the reliability gate is passed, each of the four pillars is built from its own weighted sub-metrics.
Solvency & Financial Strength, 40% of the score
This is the largest pillar, because a company that can't survive a downturn doesn't get to compete on the other three.

Profitability, 30% of the score.
Solvency tells you a company can survive; profitability tells you whether it's actually good at what it does.

Relative Valuation, 20% of the score
A great business bought at too high a price stops being a great investment, so valuation earns its own pillar, just a smaller one than the fundamentals that came before it.

Passive Income & Shareholder Returns, 10% of the score
The smallest pillar, since it matters most to income-focused investors and least to growth-focused ones, but it still rewards companies that return cash sustainably rather than recklessly.

From Raw Numbers to a Score: The Traffic-Light System
Every one of those metrics already gets a traffic-light color on Vinley's fundamentals page, and the V-Score simply reuses that same logic as its scoring input: green scores 1, orange scores 0.5, red scores 0. Each metric's score is multiplied by its weight within the pillar, the pillar totals are multiplied by their weight in the overall formula, and the reliability multiplier is applied last. Nothing about the V-Score is a separate judgment call. The V-score is the same thresholds you already trust, rolled up into one figure.
Turning the Score into a Verdict
Once the formula resolves to a percentage, it maps to the same three-color system:
Green, above 80%: strong and consistent across solvency, profitability, valuation, and shareholder returns.
Orange, 50% to 80%: a real mix, often a genuinely strong business that the market has priced richly, or a decent business with a couple of weak spots.
Red, below 50%: meaningful weakness in the underlying fundamentals, or an earnings-quality flag that has already zeroed or halved the score.
Worked Example
To see the mechanics in action, here's a walkthrough using a fictional company, Meridian Industrial, with illustrative figures. Reliability check: Beneish M-Score of −2.5, which is green, so R = 1.
Solvency

Pillar score: 0.875
Profitability

Pillar score: 0.850
Relative Valuation

Pillar score: 0.435
Dividends & Returns

Pillar score: 0.850
Composite Score
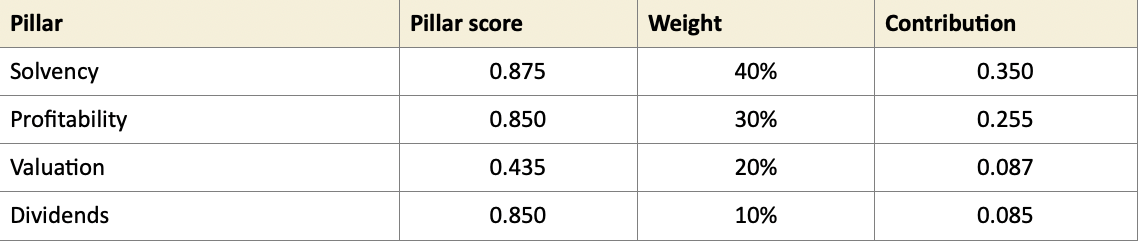
VSQS = 1 × (0.350 + 0.255 + 0.087 + 0.085) = 77.7%, which lands in the orange band.
Meridian passes the reliability gate cleanly and shows real strength in solvency and profitability, but its valuation pillar drags the composite down into orange territory. That's a common and useful pattern the V-Score is designed to surface: a fundamentally sound business that the market may have already priced higher.
Where the V-Score Fits in Your Process
The V-Score is a screening tool, not a substitute for the deeper valuation work. It compresses the reliability check and a cross-section of the fundamentals into a single comparable number, which makes it a fast way to scan a watchlist or sanity-check a name before digging further. It doesn't replace a margin-of-safety calculation against intrinsic value, and it doesn't capture qualitative moat signals like brand strength or customer sentiment. Think of it as the first filter: a green or orange V-Score earns a stock a closer look under the full analysis; a red one is a reason to ask hard questions before going any further.
You can find the V-Score on every stock's fundamentals page in Vinley, next to the traffic lights it's built from.


.png)


Comments